
A complete breakdown of the stock market, useful for players of ALL skill levels. This guide will teach you everything there is to know about the stock market and more… So much more…
Introduction
Having a Cookie Clicker save from many years ago, I already had almost everything done when the game came to steam, but I had never bothered with some of the shadow achievements until now. So as I work my way towards the Gaseous Assets achievement, I’ve found myself learning way more about the stock market than ever before, as most of the tech required to get Gaseous Assets (legitimately) is not even required to get all the other stock market achievements. But for those of you who also want Gaseous Assets, or perhaps those of you just looking to expand your game knowledge, I’ve decided to document everything right here, in one place.
It also just gives me something to do while I wait.
For cookies.
This guide is still a WIP, so please be patient with me as I add more info. If you spot any info that is wrong, please point it out in the comments so I can fix it ASAP.
Basic Info (WIP)
This section is a WIP, but since it will only contain basic info it is only vital for new players, and I will focus on it last.
Feel free to skip this section of the guide if you’re familiar with the basics of the stock market, just be sure to read the Advanced Info section.
The stock market is a minigame that one can access by spending a sugar lump to upgrade their banks to lv. 1, after which it can be accessed on any future run so long as the player owns at least 1 bank.
It may look overwhelming at first, but once you learn to read it you’ll appreciate it’s compactness.
Overview
The objective of the stock market is to buy and sell shares for different stocks in order to turn a profit. In essence, you buy shares when a stock is cheap, and sell those shares when that same stock is much more expensive.
WIP
Stocks
In the stock market, there are 16 different types of stocks (listed below), each one corresponding to a different building you already own. The amount of shares you can own for a given stock is calculated based on the level of your Offices, how many of the associated you’ve owned in this ascension, and the level of that building. To be more specific:
N = F + H + 10*L
where
N = number of shares you can own
F = bonus storage space from your offices
H = highest amount of the associated building owned this ascension
L = level of the associated building
So for example, if you just bought your 200th Time Machine, your time machines were level 3, and you have level 2 offices, you could calculate the amount of CRM shares you can own like so:
N = 25 + 200 + 10*3 = 255
| ID* | Icon | Symbol | Stock Name | Associated Building** |
|---|---|---|---|---|
| 0 | CRL | Cereals | Farm | |
| 1 | CHC | Chocolate | Mine | |
| 2 | BTR | Butter | Factory | |
| 3 | SUG | Sugar | Bank | |
| 4 | NUT | Nuts | Temple | |
| 5 | SLT | Salt | Wizard Tower | |
| 6 | VNL | Vanilla | Shipment | |
| 7 | EGG | Eggs | Alchemy Lab | |
| 8 | CNM | Cinnamon | Portal | |
| 9 | CRM | Cream | Time Machine | |
| 10 | JAM | Jam | Antimatter Condenser | |
| 11 | WCH | White Chocolate | Prism | |
| 12 | HNY | Honey | Chancemaker | |
| 13 | CKI | Cookies | Fractal Engine | |
| 14 | RCP | Recipies | Javascript Console | |
| 15 | SBD | Subsidiaries | Idleverse |
* All calculations done using these IDs add 1, so you can just think of their ID’s as a numerical label in the order they appear. (i.e. CRL is 1 & SBD is 16)
** Note that Grandmas and Cursors do not have any stocks associated with them. They are both special cases, and are loosely associated with Brokers and Offices respectively, which are described below.
Brokers
WIP
Offices
WIP
Loans
WIP
Advanced Info
I would reccomend players of all skill levels read this section.
Ceilings, Floors, & Resting Values
Each stock has 3 values that you need to familiarize yourself with: Its Ceiling, Floor, and Resting Value.
The Ceiling Value of a stock is the absolute highest value you can ever expect that stock to reach. This is the ultimate selling point, and if a stock reaches it’s ceiling (or even gets within $5-10 of it) you should always sell. The value of a stock can rise beyond this number, but past this point any positive delta is decreased by 10% per tick, which basically means it it will quickly fall back down.
The Floor Value of a stock is the absolute lowest value you can ever expect that stock to reach. It’s like the ceiling but in the other direction, so always buy if a stock is near it’s floor. The floor of a stock usually doesn’t come in to play nearly as often as its ceiling, since the floor of most stocks is below $0, and stock values have a hard limit to never go below $1, but it is still important to know for the more expensive stocks. In general, if a stock’s value is either below $5 or within $10 of its floor, buy its shares immediately.
The Resting Value of a stock is the absolute most important of these 3 values to know, as it is the value that the stock wants to return to if given the chance. It’s not just the average value of that stock, it will actively try to return to this value when possible, making it extremely important to know for strategic selling and buying (more on this later). The resting value of a stock actually also somewhat overpowers the Bank Ceiling, but not to enough of an extent to be worth risking your money on it.
Here is a table of the default Ceiling, Floor, and Resting Values for each stock. It’s quite easy to remember, since the values increment by $10 for the next stock type.
| Icon | Stock | Ceiling | Floor | Resting |
|---|---|---|---|---|
| CRL | $59 | -$91 | $9 | |
| CHC | $69 | -$81 | $19 | |
| BTR | $79 | -$71 | $29 | |
| SUG | $89 | -$61 | $39 | |
| NUT | $99 | -$51 | $49 | |
| SLT | $109 | -$41 | $59 | |
| VNL | $119 | -$31 | $69 | |
| EGG | $129 | -$21 | $79 | |
| CNM | $139 | -$11 | $89 | |
| CRM | $149 | -$1 | $99 | |
| JAM | $159 | $9 | $109 | |
| WCH | $169 | $19 | $119 | |
| HNY | $179 | $29 | $129 | |
| CKI | $189 | $39 | $139 | |
| RCP | $199 | $49 | $149 | |
| SBD | $209 | $59 | $159 |
The ceiling, floor*, and resting values of all stocks can only be increased by leveling your banks with sugar lumps. For every 1 level your banks have, all stocks permanently raise their Ceiling, Floor*, and Resting Value by $1. Thus at level 10 banks, all values listed on the table above would be increased by $10.
* Unconfirmed whether the floor value of a stock is affected by bank levels. For now, I simply assume this is the case in this guide.
Bank Ceiling
In addition to each stock having its own ceiling value, there is also a Bank Ceiling (or Market Cap) that must be taken into account. This acts like an overall ceiling value for ALL stocks, and will set the hard cap on how high all stocks can go. Even if a stock has a ceiling value higher than the bank ceiling, once it reaches the bank ceiling it will be stopped just as if it had reached its own ceiling value.
The bank ceiling can also be increased by leveling your banks, but it increases by $3 per bank level instead of $1 per level. By default, your bank ceiling starts at $97 (so at level 1 your bank ceiling is exactly $100), and will increase by $3 for every level you give your banks.
Stock RNG
This is by far the most technical part of the stock market, though most of the information is actually quite unneccessary to know, just the general gist of it is fine. If you would like to know more, check out the wiki page for all the details. – [fandom.com]
There is only one important aspect to the RNG that I will cover in this guide: a stock’s “Delta” value.
When the stock market ticks, every stock updates with a new value. How this value is chosen is based on RNG, as well as which mode it is in, and is also affected by it’s delta value. The delta of a stock is literally a “change in value” for the stock, or more simply a number assigned to how fast it is moving in a given direction. Every tick, 2 mode-dependant RNG calls occur:*
- A random number** is picked, and the value of the stock increases/decreases by that amount.
- A random number** is added/subtracted to the delta value, then the delta value is added to the value of the stock.
So as an example, let’s say we have a stock worth $20, and it’s delta is at -0.21 (it has some momentum moving downwards).
- The next tick, RNG tells the stock to increase it’s value by 0.3 (which would put it at $20.30)
- RNG also adds -0.04 to the delta value, meaning it now has a delta of -0.25.
- The value is changed by the new delta amount of -0.25 (which would put it at $20.05)
From the player’s perspective, the value increased by $0.05, but in reality the delta just decreased even further, adding more to the already present downward momentum this stock was experiencing.
* Although mutliple re-calculations and calls usually happen, this is just a simplified example that is about the extent of what is important to understand.
** The possible ranges for these random numbers are determined by what mode the stock is in. These numbers are also tweaked
Modes
In addition to regular stock RNG, each stock is always in one of six “modes”, which impose additional rules to its RNG in order to make it more likely to act a certain way.
Each time a stock is assigned a mode, it is given a duration randomly selected between 10 and 1000, which decrements every time the stock market ticks. Since stock market ticks happen every 1 minute, this means that sometimes modes can last for up to 1000 minutes (16 hours & 40 minutes). Once the duration counter hits 0, the stock is randomly assigned a new mode.
The main challenge in the stock market is identifying exactly which mode a stock is in; if you can do that, you can make a lot more profit a lot more consistently (more on this later).
Mode 0: “Stable”
12.5% chance
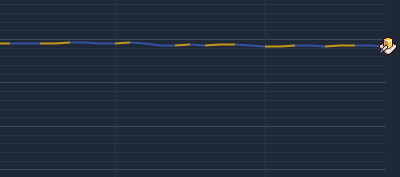
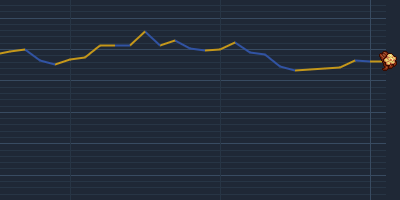
In mode 0, the idea is that the stock’s value won’t move much per tick, with the delta kept quite close to 0, and is equally likely to move in either direction. In theory, this should lead to a stable line graph similar to the one shown in the picture to the right, but in practice this isn’t always the case. The tendency for the stock’s value to drift back towards the resting value can often overpower the low activity and cause the stock to gain momentum in a direction, so at times it can end up looking a lot more like mode 1 or mode 2.
Mode 1: “Slow Climb”
25% chance
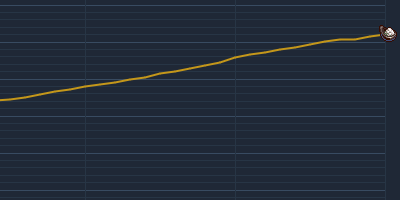
In mode 1, the stock’s delta is kept low, and value changes are minimal, but both the delta and value changes are weighted to increase the value of the stock more often than it decreases. This usually leads to a line graph like the one shown on the right, but with some bad RNG and a value that is already close to or beyond the stock’s resting value, it can alternate moving up and down often enough to look much more like mode 0. Sometimes the delta picks up enough momentum in the negative direction from bad RNG to make mode 1 look like mode 2, further adding to the confusion.
Mode 2: “Slow Fall”
25% chance
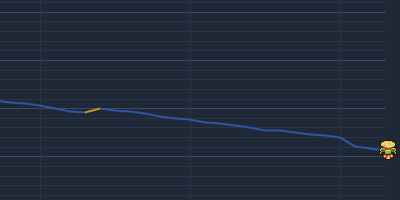
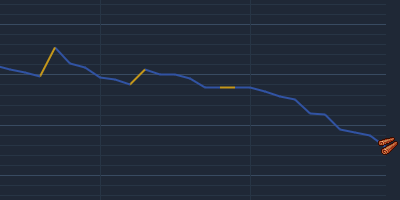
In mode 2, the stock’s delta is kept low, and value changes are minimal, but both the delta and value changes are weighted to decrease the value of the stock more often than it increases. This usually leads to a line graph like the one shown on the right, and although it happens a bit less often than with mode 1, it can be overpowered by some bad RNG gaining momentum in the positive direction, resulting in mode 2 sometimes looking more like mode 0 or even mode 1.
Mode 3: “Fast Climb”
12.5% chance
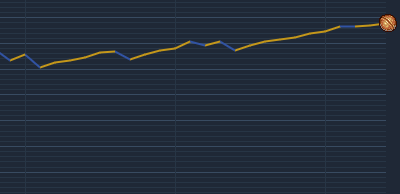
In mode 3, each tick is weighed heavily to increase the value of the stock, and is therefore the mode in which stock values tend to climb the fastest. Despite not actually being any rarer than mode 4, this mode is still the rarest mode to encounter due to having an additional rule: Every tick, this stock has a 3% chance to immediately switch to mode 4, regardless of how much longer the stock could have stayed in mode 3. When this happens, it is not treated as a normal mode switch, meaning there is no 70% chance to enter mode 5, and the duration from mode 3 carries over to mode 4 instead of a new duration being generated. This almost always leads to stocks in mode 3 getting cut off much sooner, thus lasting a lot less time and being rarer to see. This is typically the easiest mode to identify out of all six modes, especially because of how uncommon it is to see it.
Mode 4: “Fast Fall”
12.5% chance
In mode 4, each tick is weighed heavily to decrease the value of the stock, and is therefore the mode in which stock values tend to fall the fastest. This is typically the second easiest mode to spot out of the six, though large upward spikes can make it tricky. Usually, telling when mode 4 ends proves to be the challenging part.
Mode 5: “Chaotic”
12.5% chance
In mode 5, each tick changes the delta and value by a random, potentially large amount, with an equal likelihood of it being positive or negative. Additionally, mode 5 features 2 extra rules:
- When a stock switches modes from mode 4 or mode 3, there is a 70% chance to override that mode switch, instead making the stock switch to mode 5.
- In mode 5, every tick has a 20% chance to completely override the current delta value with a random delta value between -1 and 1, effectively causing all momentum in either direction to stop and be reset.
Mode Recognition (WIP)
Mode recognition is the most vital skill to have in order to be successful in the stock market, so this part of the guide is extremely important. Here I will cover examples of weak/strong modes, explain why they may happen, and how you can go about identifying and distinguishing between them.
WIP
Hope you enjoy the Guide about Cookie Clicker – Stock Market Spreadsheet – ID’s – Icon – Symbol, if you think we should add extra information or forget something, please let us know via comment below, and we will do our best to fix or update as soon as possible!
- All Cookie Clicker Posts List


Update info to newest version of cookie clicker, does not currently include new buildings (12/5/2023 5:34 P.M. EST)